Interactive and Batch Tools
Introduction
 button, the chosen analysis tool will either be run interactively (you wait for the results to be displayed) or will be submitted to a batch queue. The Launch page indicates which method is to be used. Figure 6.1 (above) shows the Launch page for a tool which is to be run interactively. Figure 6.4 (below) shows a typical batch queue message from a Launch page for a tool which has been sent to a batch queue.
Note:The choice of whether tools are run interactively or submitted to batch queues depends on how SRS has been set up.
The next sections describe these methods (see sections "Interactive Tools" and "Batch Tools").
Interactive Tools
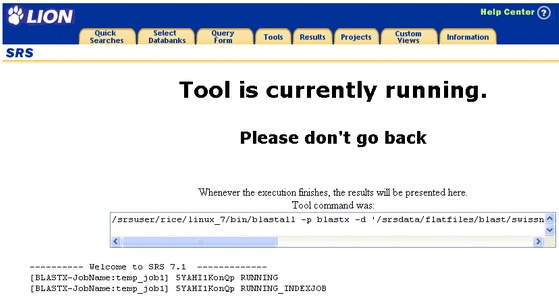
Figure 6.2 Tool Invocation page.The Query Result page ( Figure 6.3 ) will appear automatically on completion unless the show results automatically check box has been unticked.
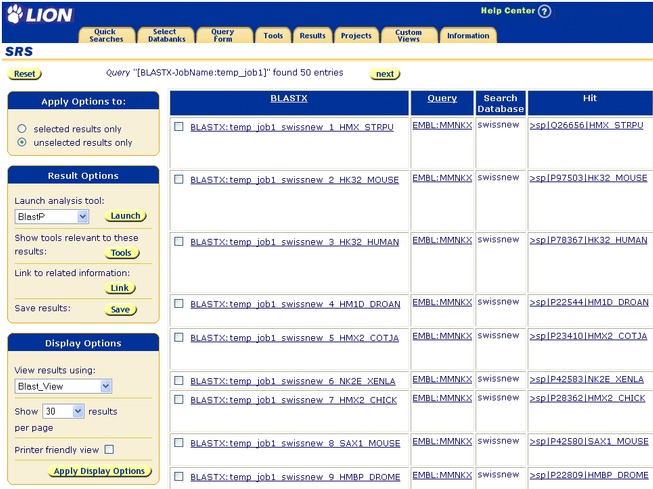
Figure 6.3 Query Result page showing the results of an analysis using BLASTX.
Batch Tools
Introduction to Batch Tools
Tools which are likely to take a while to run are usually set to run as batch jobs. SRS does not wait while batch jobs are run. Instead you can carry on with further queries, etc. and return to look at the results of your analysis when it is complete. If a job will be run from the batch queue this is indicated on the Launch page prior to launching ( Figure 6.4 ).
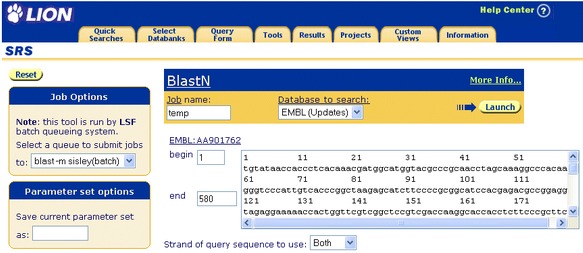
Figure 6.4 Typical SRS batch queuing message from a Launch page, for a run of BLASTN.
Tool Invocation Page for Batched Tools
After the button is clicked, the Tool Invocation page will be shown.
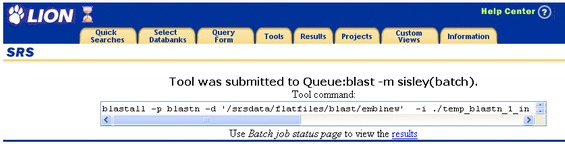
Figure 6.5 Tool Invocation page for batch processing.
Accessing the Results
The results from an analysis can be reached from the Job Status page (see Figure 6.6 ). This page is reached by clicking on the  hyperlink or on the
  icon on the Tool Invocation page.
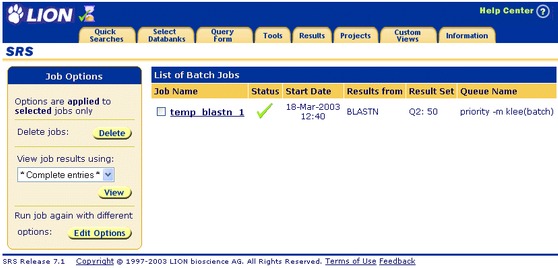
Figure 6.6 Job Status page.When a job has completed, the job name becomes a link to the results of your analysis, and the hourglass
becomes an hourglass with a green tick  . Clicking on the hyperlink for the job that has just run, e.g.
  will display the Entry page containing the results.
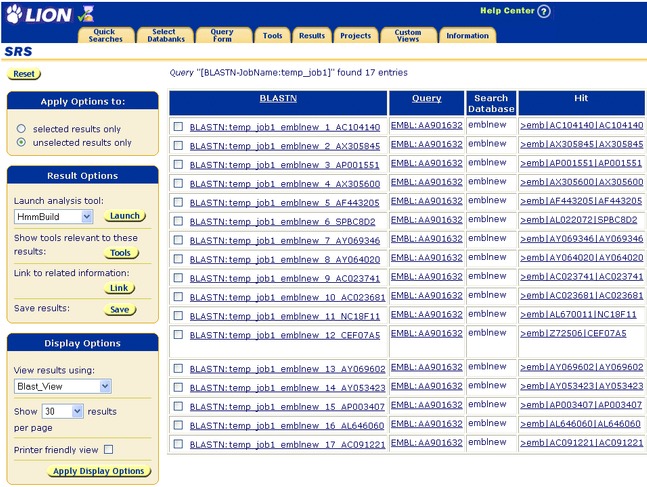
Figure 6.7 Entry page showing openAlternatively, it is possible to select a job by ticking the check box beside it, selecting a view and clicking the
 button. This will display the results on a Query Result page.
Job Status
The Job Status page (see Figure 6.8 ) lists all batch jobs in the current project and shows their current status. (The most recent job is at the top of the list.)
-
Completed jobs are shown with a
 icon.
icon. -
Jobs still running are shown with a
 icon.
icon. -
Waiting jobs (i.e. those which are waiting to be run) are shown with a
 icon.
icon. -
Jobs that have been submitted to the queue are shown with a a
 icon.
icon. -
Jobs which have produced no meaningful results (e.g. those for which the search sequence produced no appropriate results or those which have crashed) are shown with a
 icon.
icon. -
Jobs which have unspecified problems may be shown with a a
 icon.
icon.
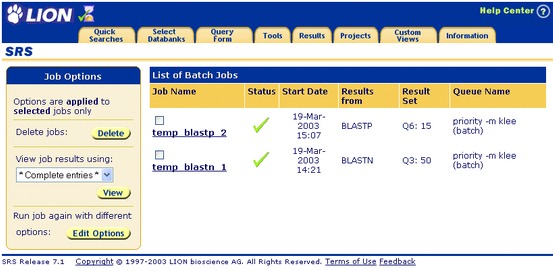
Figure 6.8 Job Status page showing multiple jobs.
Accessing the Job Status Page
The icon appears on SRS pages when batch jobs exist,and can be used to access the Job Status page. It changes to , when all jobs have completed.
Various analysis tools can be run on queries within SRS. This chapter describes how to:
- Use the tools that are available within SRS.
